Clear, comparable measures of how British Columbia's local governments deliver services, benchmarked against their peers and explained in context.
Compare
Every BC municipality, measured the same way. Compare with peers of a similar size, your region, or a group you choose, across more than 150 measures and 15 service areas.
Understand
Results that stand out come with context: footnotes on how figures are reported, and short, sourced explanations of what drove a change.
Share
Council-ready reports, and every chart exported to PowerPoint and Excel in your organization's own fonts and colours.
By the numbers
Sample report
See how a municipality compares
Each municipality gets a full benchmark report against peers it chooses: where it ranks, how it is trending, and why the results look the way they do. We'd be glad to walk you through yours.
Book a walkthrough →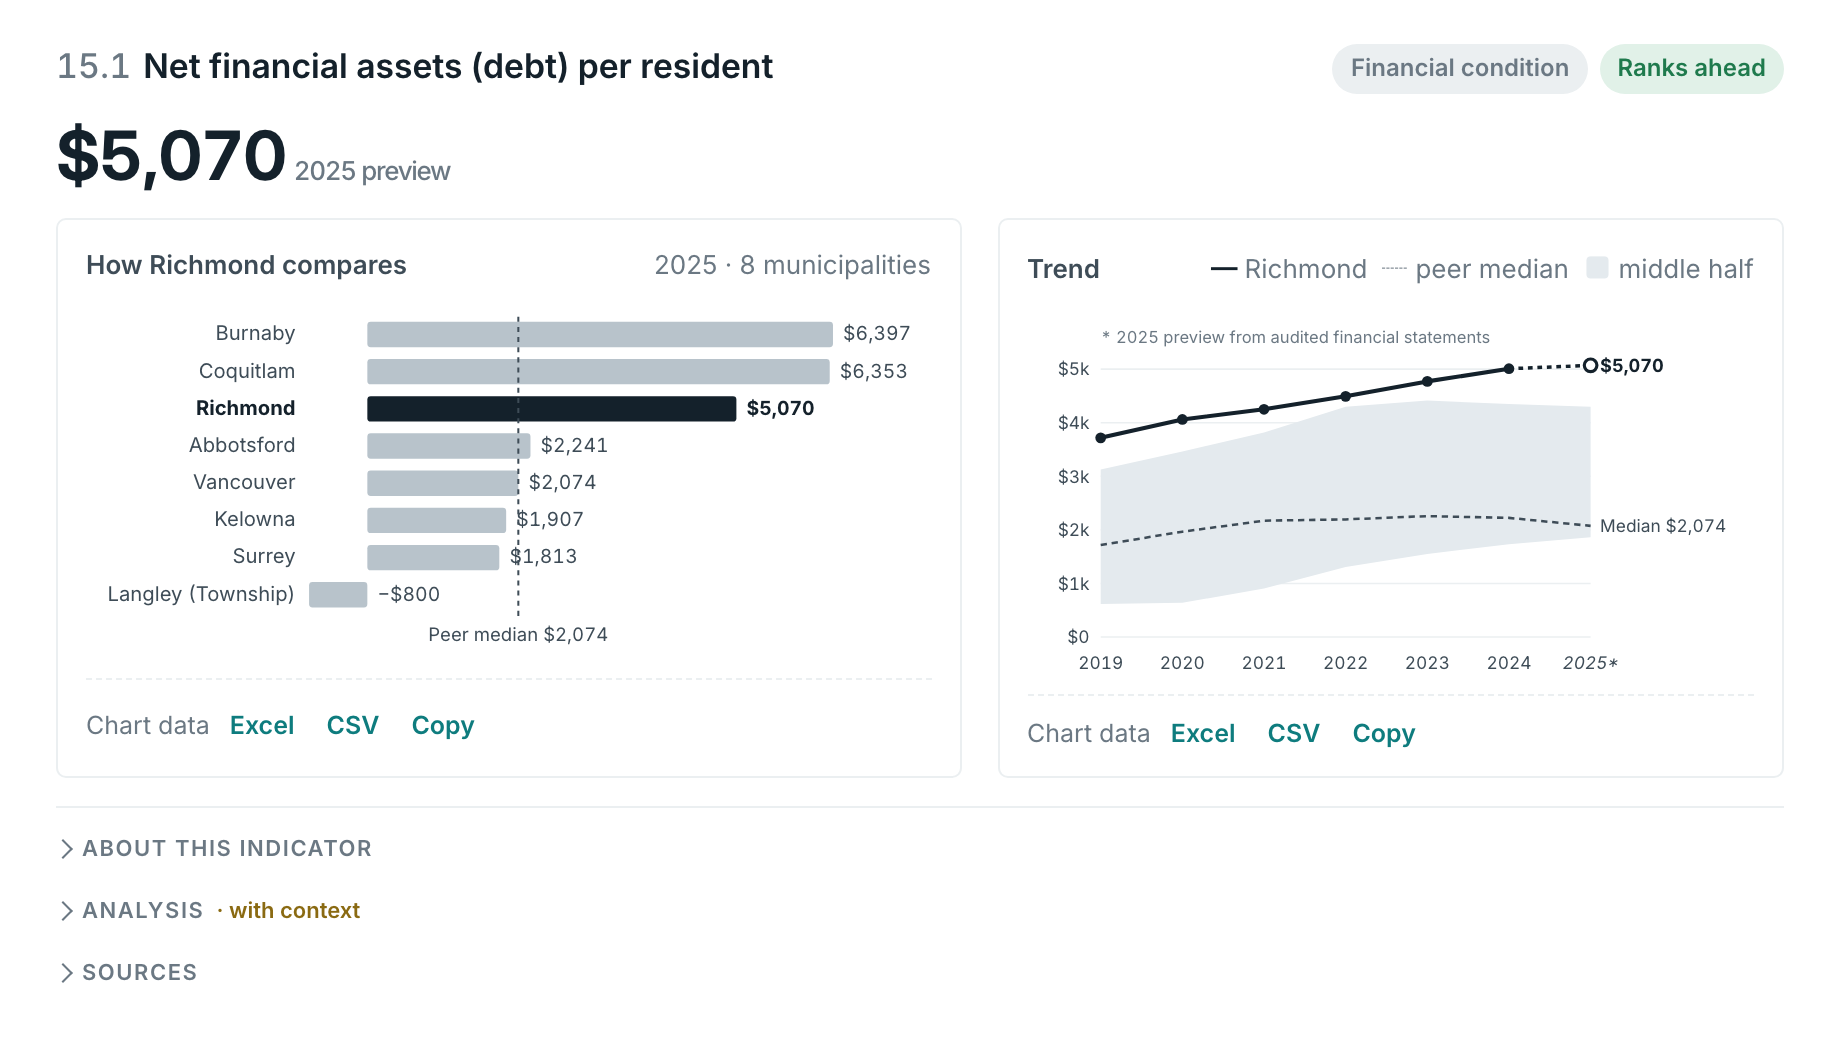
Built on public data
Sources local governments already trust
- Province of BC local government statistics
- BC Stats population estimates
- Statistics Canada
- CMHC housing market data
- Provincial climate and emissions data
- Municipal annual reports and audited statements
And on member data
Measures that go beyond public data
Each year, member local governments provide additional measures and see how they compare with their peers on them.
Shared by members, compared as a group
Figures each local government already tracks or files, on its services, operations and finances, brought together on a common basis.
Private by design
- Your unpublished figures are shown to others only within group figures, such as the median.
- Comparisons appear only when at least five comparable local governments take part.
- How you compare is shown only to you.
- Your data is never sold.
Collaborate with us
Help shape Civic Indicators BC
We're looking to collaborate with a small group of municipalities to build and refine the product before it is offered more widely.